
SCIENCE!
Below are some fun results from our modeling and hydrology research that we would like to share.
Take some time, peruse, and ENJOY!
Roadway Flooding Model

This animated figure shows preliminary results modeling roadway flooding due to rising groundwater levels. There are three parts:
The uppermost figure depicts the land cover of the modeled area with grass (green), roadway (dark gray), and railroad (light gray). There are also two red lines (A-A′ vertical, B-B′ horizontal) denoting the locations of the cross-sections depicted in the remaining two figures in the gif. The map also highlights locations where flooding occurs at the land surface due to groundwater seepage (after 15 hours).
The middle figure shows the subsurface cross-section between A and A′. Land surface elevation is depicted by a black line, while groundwater elevation is depicted as a blue line. Throughout the length of the gif, the blue groundwater levels begin rising and eventually cause runoff to occur in the roadway (denoted by a pink bar that grows as modeled runoff increases). Along this North to South cross-section, surface runoff only occurs in the low-point of the roadway toward the end of the simulation.
The final figure shows the subsurface cross-section between B and B′. Land surface elevation is depicted by a black line, while groundwater elevation is depicted as a blue line. Throughout the length of the figure, the blue groundwater levels begin rising and eventually cause runoff to occur in the roadway (denoted by a pink bar that grows as modeled runoff increases). Runoff is very minimal across this West to East cross-section.
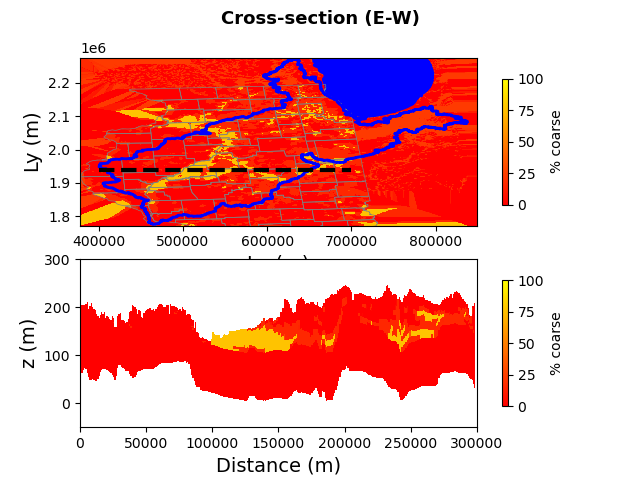
Plot and Detail of the Illinois River Basin
The upper plot shows the outlines of the state of Illinois, Lake Michigan, and the Illinois River Basin being modeled. A black dashed line across the middle of the state shows the location of the detail cross-section in the lower plot.
The lower plot shows the cross-section of the upper 200 meters of geology. The map is colored by a gradient colormap of the percentage of “coarse” material, where yellow is 100% transitioning to red at 0% coarse. The cross-section identifies stark areas of near 100% coarse material, likely representing the Mahomet aquifer in central IL.
Illinois Basin Model

This plot outlines the state of Illinois, Lake Michigan, and the Illinois River Basin being modeled.
Within the Illinois River Basin, ISWS records of groundwater nitrate concentrations are plotted by the location of the sample. Each record is indicated by a circle that grows larger and deeper in red color as nitrate concentrations increase.
Elevation Plot of the Illinois River Basin
This plot outlines the state of Illinois, Lake Michigan, and the Illinois River Basin being modeled.
The Illinois River Basin watershed is colored by elevation of the bedrock surface throughout the basin. Elevation is presented in meters above mean sea level, with white depicting 349.618 meters transitioning to black which shows 0.0 meters. Areas of deepest bedrock elevation are along the southern half of the Illinois River and in Mason County, IL (where the Mahomet Aquifer is prevalent).

Imperial Valley Water Authority Model Area

A map of the Imperial Valley Water Authority model area boundary (dashed line), the Mason City model area boundary (solid line), the Illinois River Basin model area boundary (dotted line), and the Illinois River Basin (blue line).
The Imperial Valley Water Authority model area and the Mason City model area are at higher resolution and have greater detail than the surrounding Illinois River Basin model. This model inset allows the modeling team to incorporate greater detail in this refined region, but still allows the larger regional context to influence those detailed dynamics.
Groundwater Pressure Plot
A plot comparing simulated groundwater pressures against observed values. A dashed black line marks the 1-to-1 line where ideally all points would fall. There are numerous iterations of the model plotted on this graph, with poorly calibrated points in gray and well-calibrated model points in black.
The gray points in this figure also represent the numerous model configurations and parameterizations that were explored as a part of our Parameter ESTimation (PEST) analysis.

Soil Moisture Content

This figure displays two time series plots of soil moisture content at depths of 40 centimeters. The upper plot (a) shows model soil moisture results when the model is calibrated with constant hydraulic parameters, while the lower plot (b) depicts model estimates when calibrated with seasonal hydraulic parameters.
The models with seasonal hydraulic parameters better match the field observations, including similarly timed peaks in soil moisture content. Model calibration was improved using a machine learning algorithm called a “genetic algorithm” (or an “evolutionary strategy”). This analysis simulated tens of thousands of model runs on the Illinois Campus Cluster, the high-performance computing cluster run by the University of Illinois Urbana-Champaign.
Hydraulic Conductivity
This set of nine maps depicts the modeled hydraulic conductivity of each layer within a nine-layer hydrologic model of an area in southwestern Illinois. Layer 1 signifies the subsurface layer nearest the land surface, and layer 9 is that closest to bedrock. Hydraulic conductivity generally increases with depth in this region.
